Mapping Tree Positions and Heights Using PointCloud Data Obtained Using LiDAR Technology
The goal of the collaboration between the Slovak National Supercomputing Centre (NSCC) and the company SKYMOVE within the National Competence Center for HPC project was to design and implement a pilot software solution for processing data obtained using LiDAR (Light Detection and Ranging) technology mounted on drones.
Data collection
LiDAR is an innovative method of remote distance measurement that is based on measuring the travel time of laser pulse reflections from objects. LiDAR emits light pulses that hit the ground or object and return to the sensors. By measuring the return time of the light, LiDAR determines the distance to the point where the laser beam was reflected.
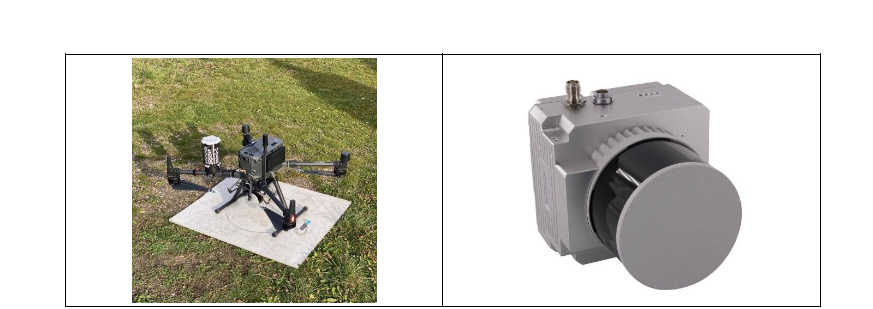
LiDAR can emit 100k to 300k pulses per second, capturing dozens to hundreds of pulses per square meter of the surface, depending on specific settings and the distance to the scanned object. This process creates a point cloud (PointCloud) consisting of potentially millions of points. Modern LiDAR use involves data collection from the air, where the device is mounted on a drone, increasing the efficiency and accuracy of data collection. In this project, drones from DJI, particularly the DJI M300 and Mavic 3 Enterprise (Fig. 1), were used for data collection. The DJI M300 is a professional drone designed for various industrial applications, and its parameters make it suitable for carrying LiDAR.
The DJI M300 drone was used as a carrier for the Geosun LiDAR (Fig. 1). This is a mid-range, compact system with an integrated laser scanner, a positioning, and orientation system. Given the balance between data collection speed and data quality, the data was scanned from a height of 100 meters above the surface, allowing for the scanning of larger areas in a relatively short time with sufficient quality.
The collected data was geolocated in the S-JTSK coordinate system (EPSG:5514) and the Baltic Height System after adjustment (Bpv), with coordinates given in meters or meters above sea level. In addition to LiDAR data, aerial photogrammetry was performed simultaneously, allowing for the creation of orthophotomosaics. Orthophotomosaics provide a photographic record of the surveyed area in high resolution (3 cm/pixel) with positional accuracy up to 5 cm. The orthophotomosaic was used as a basis for visual verification of the positions of individual trees.
Data classification
The primary dataset used for the automatic identification of trees was a LiDAR point cloud in LAS/LAZ format (uncompressed and compressed form). LAS files are a standardized format for storing LiDAR data, designed to ensure efficient storage of large amounts of point data with precise 3D coordinates. LAS files contain information about position (x, y, z), reflection intensity, point classification, and other attributes necessary for LiDAR data analysis and processing. Due to their standardization and compactness, LAS files are widely used in geodesy, cartography, forestry, urban planning, and many other fields requiring detailed and accurate 3D representations of terrain and objects.
The point cloud needed to be processed into a form that would allow for an easy identification of individual tree or vegetation points. This process involves assigning a specific class to each point in the point cloud, known as classification.
Various tools can be used for point cloud classification. Given our positive experience, we decided to use the Lidar360 software from GreenValley International [1]. In the point cloud classification, the individual points were classified into the following categories: unclassified (1), ground (2), medium vegetation (4), high vegetation (5), buildings (6). A machine learning method was used for classification, which, after being trained on a representative training sample, can automatically classify points of any input dataset (Fig. 2).
The training sample was created by manually classifying points in the point cloud into the respective categories. For the purposes of automated tree identification in this project, the ground and high vegetation categories are essential. However, for the best classification results of high vegetation, it is also advisable to include other classification categories. The training sample was composed of multiple smaller areas from the entire region including all types of vegetation, both deciduous and coniferous, as well as various types of buildings. Based on the created training sample, the remaining points of the point cloud were automatically classified. It should be noted that the quality of the training sample significantly affects the final classification of the entire area.
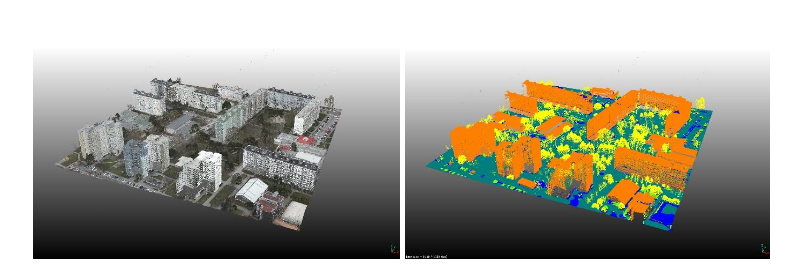
Figure 2. Example of a point cloud of an area colored using an orthophotomosaic (left) and the corresponding classification (right) in CloudCompare.
Data segmentation
In the next step, the classified point cloud was segmented using the CloudCompare software [2]. Segmentation generally means dividing classified data into smaller units – segments that share common characteristics. The goal of segmenting high vegetation was to assign individual points to specific trees.
For tree segmentation, the TreeIso plugin in the CloudCompare software package was used, which automatically recognizes trees based on various height and positional criteria (Fig. 3). The overall segmentation consists of three steps:
- Grouping points that are close together into segments and removing noise.
- Merging neighboring point segments into larger units.
- Composing individual segments into a whole that forms a single tree.
The result is a complete segmentation of high vegetation. These segments are then saved into individual LAS files and used for further processing to determine the positions of individual trees. A significant drawback of this tool is that it operates only in serial mode, meaning it can utilize only one CPU core, which greatly limits its use in an HPC environment.
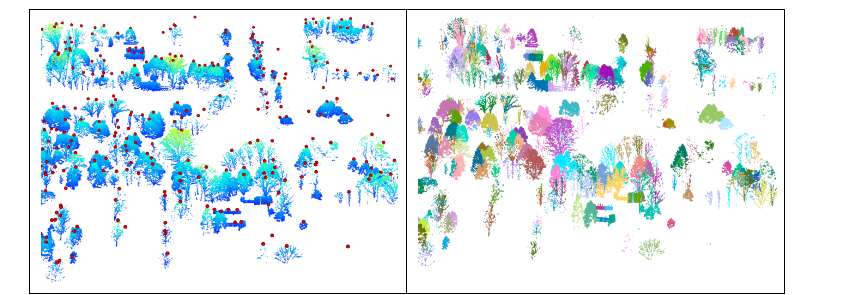
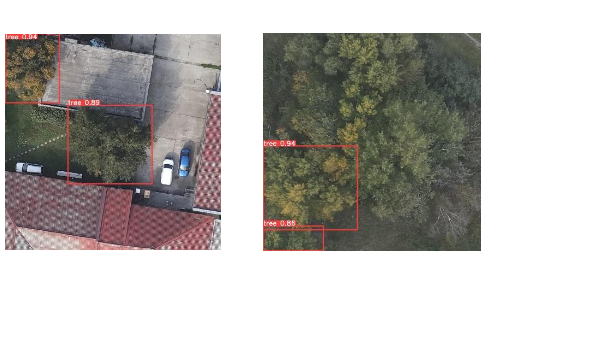
As an alternative method for segmentation, we explored the use of orthophotomosaics of the studied areas. Using machine learning methods, we attempted to identify individual tree crowns in the images and, based on the geolocational coordinates determined, identify the corresponding segments in the LAS file. For detecting tree crowns from the orthophotomosaic, the YOLOv5 model [3] with pretrained weights from the COCO128 database [4] was used. The training data consisted of 230 images manually annotated using the LabelImg tool [5]. The training unit consisted of 300 epochs, with images divided into batches of 16 samples, and their size was set to 1000x1000 pixels, which proved to be a suitable compromise between computational demands and the number of trees per section. The insufficient quality of this approach was particularly evident in areas with dense vegetation (forested areas), as shown in Figure 4. We believe this was due to the insufficient robustness of the chosen training set, which could not adequately cover the diversity of image data (especially for different vegetative periods). For these reasons, we did not develop segmentation from photographic data further and focused solely on segmentation in the point cloud.
To fully utilize the capabilities of the Devana supercomputer, we deployed the lidR library [6] in its environment. This library, written in R, is a specialized tool for processing and analyzing LiDAR data, providing an extensive set of functions and tools for reading, manipulating, visualizing, and analyzing LAS files. With lidR, tasks such as filtering, classification, segmentation, and object extraction from point clouds can be performed efficiently. The library also allows for surface interpolation, creating digital terrain models (DTM) and digital surface models (DSM), and calculating various metrics for vegetation and landscape structure. Due to its flexibility and performance, lidR is a popular tool in geoinformatics and is also suitable for HPC environments, as most of its functions and algorithms are fully parallelized within a single compute node, allowing for full utilization of available hardware. When processing large datasets where the performance or capacity of a single compute node is insufficient, splitting the dataset into smaller parts and processing them independently can leverage multiple HPC nodes simultaneously.
The lidR library includes the locate_trees() function, which can reliably identify tree positions. Based on selected parameters and algorithms, the function analyzes the point cloud and identifies tree locations. In our case, the lmf algorithm, based on maximum height localization, was used [7]. The algorithm is fully parallelized, enabling efficient processing of relatively large areas in a short time.
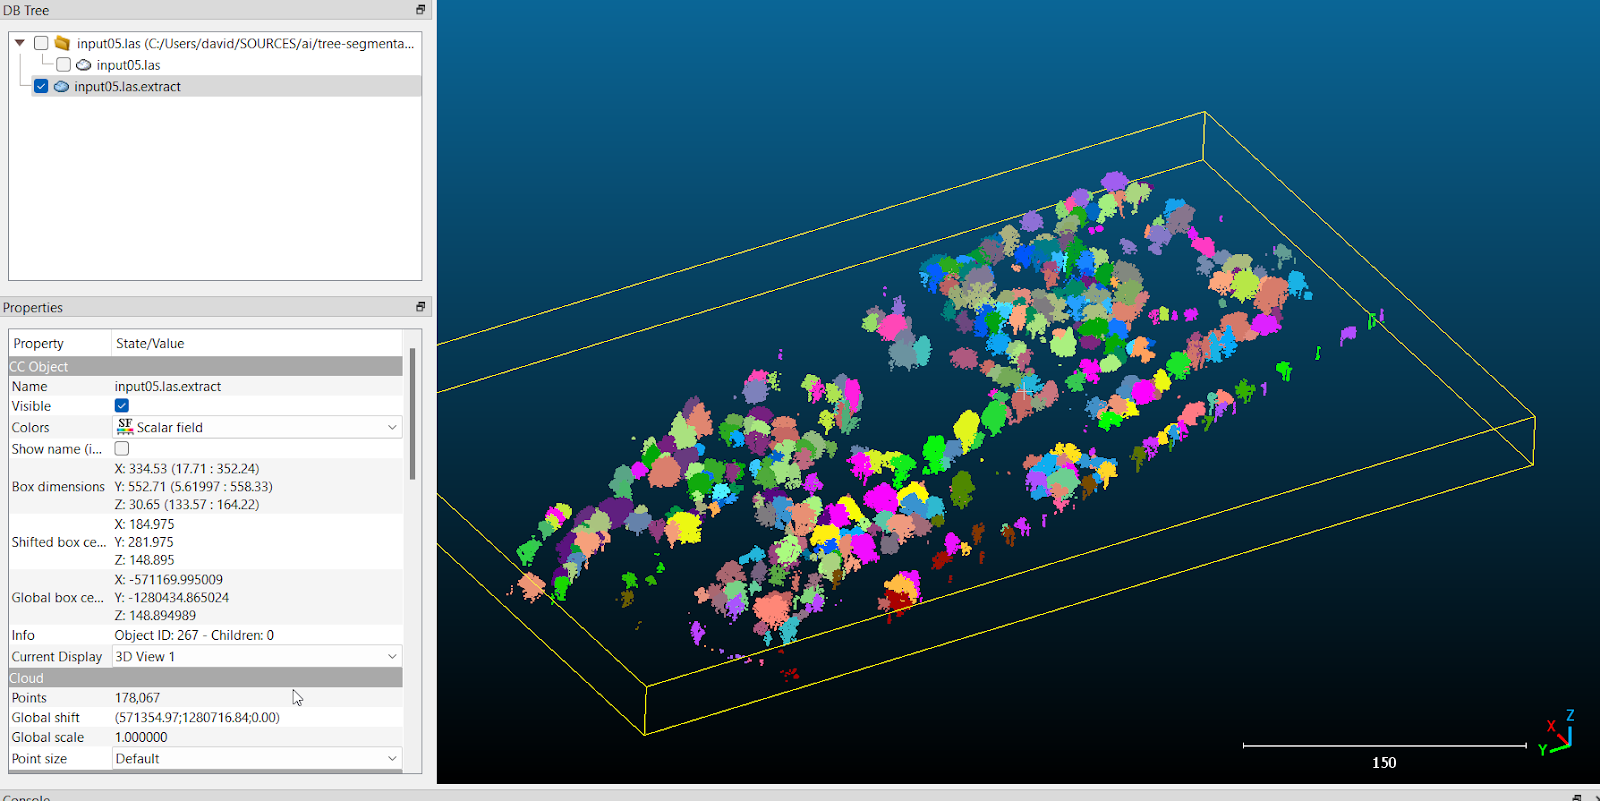
The identified tree positions can then be used in the silva2016 algorithm for segmentation with the segment_trees() function [8]. This function segments the identified trees into separate LAS files (Fig. 5), similar to the TreeIso plugin module in CloudCompare. These segmented trees in LAS files are then used for further processing, such as determining the positions of individual trees using the DBSCAN clustering algorithm [9].
Detection of tree trunks using the DBSCAN clustering algorithm
To determine the position and height of trees in individual LAS files obtained from segmentation, we used various approaches. The height of each tree was obtained based on the z-coordinates for each LAS file as the difference between the minimum and maximum coordinates of the point clouds. Since some point cloud segments contained more than one tree, it was necessary to identify the number of tree trunks within these segments.
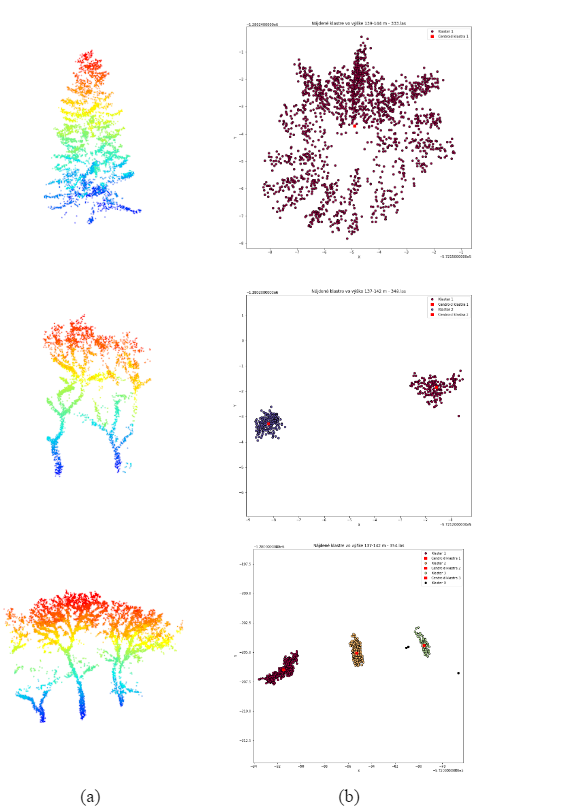
Tree trunks were identified using the DBSCAN clustering algorithm with the following settings: maximum distance between two points within one cluster (= 1 meter) and minimum number of points in one cluster (= 10). The position of each identified trunk was then obtained based on the x and y coordinates of the cluster centroids. The identification of clusters using the DBSCAN algorithm is illustrated in Figure 6.
Determining tree heights using surface interpolation
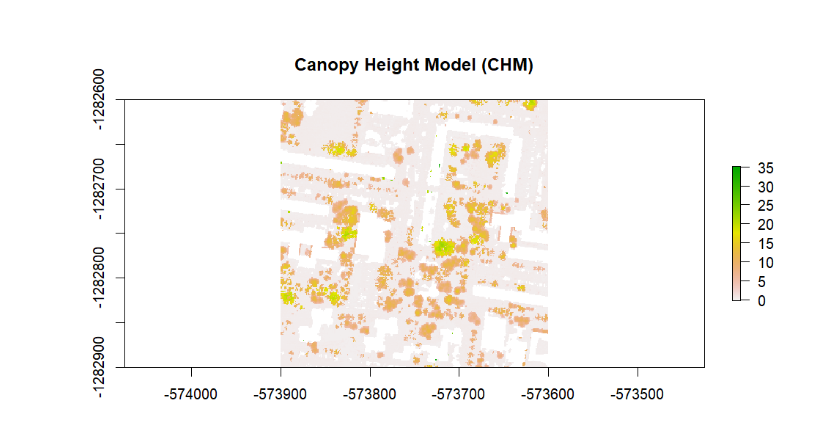
As an alternative method for determining tree heights, we used the Canopy Height Model (CHM). CHM is a digital model that represents the height of the tree canopy above the terrain. This model is used to calculate the height of trees in forests or other vegetative areas. CHM is created by subtracting the Digital Terrain Model (DTM) from the Digital Surface Model (DSM). The result is a point cloud, or raster, that shows the height of trees above the terrain surface (Fig. 7).
If the coordinates of tree's position are known, we can easily determine the corresponding height of the tree at that point using this model. The calculation of this model can be easily performed using the lidR library with the grid_terrain() function, which creates the DTM, and the grid_canopy() function, which calculates the DSM.
Comparison of results
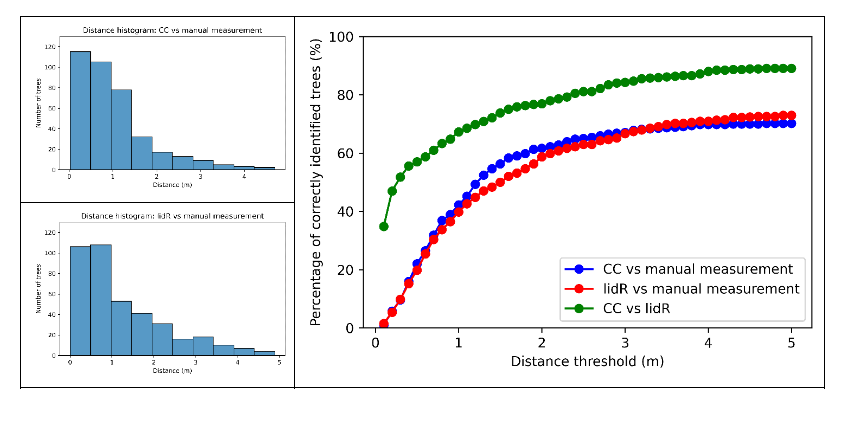
To compare the results achieved by the approaches mentioned before, we focused on the Petržalka area in Bratislava, where manual measurements of tree positions and heights had already been conducted. From the entire area (approximately 3500x3500 m), we selected a representative smaller area of 300x300 m (Fig. 2). We obtained results for the TreeIso plugin module in CloudCompare (CC), working on a PC in a Windows environment, and results for the locate_trees() and segment_trees() algorithms using the lidR library in the HPC environment of the Devana supercomputer. We qualitatively and quantitatively evaluated the tree positions using the Munkres (Hungarian Algorithm) [10] for optimal matching. The Munkres algorithm, also known as the Hungarian Algorithm, is an efficient method for finding the optimal matching in bipartite graphs. Its use in matching trees with manually determined positions means finding the best match between trees identified from LiDAR data and their known positions. By setting an appropriate distance threshold in meters (e.g., 5 m), we can qualitatively determine the number of accurately identified tree positions. The results are processed using histograms and percentage accuracy of tree positions depending on the chosen precision threshold (Fig. 8). We found that both methods achieve almost the same result at a 5-meter distance threshold, approximately 70% accurate tree positions. The method used in CloudCompare shows better results, i.e., a higher percentage at lower threshold values, as reflected in the corresponding histograms (Fig. 8). When comparing both methods, we achieve up to approximately 85% agreement at a threshold of up to 5 meters, indicating the qualitative parity of both approaches. The quality of the results is mainly influenced by the accuracy of vegetation classification in point clouds, as the presence of various artifacts incorrectly classified as vegetation distorts the results. Tree segmentation algorithms cannot eliminate the impact of these artifacts.
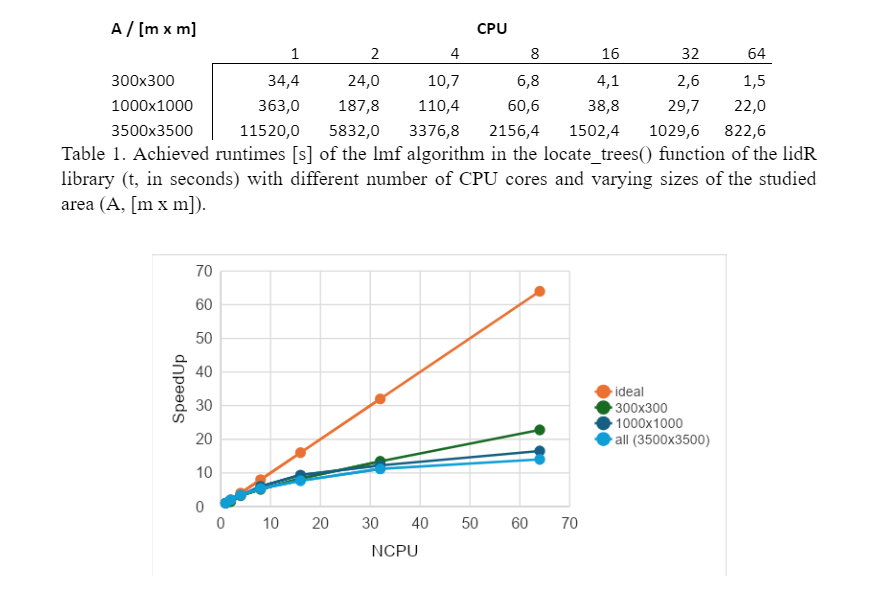
Parallel efficiency analysis of the locate_trees() algorithm in the lidR library
To determine the efficiency of parallelizing the locate_trees() algorithm in the lidR library, we applied the algorithm to the same study area using different numbers of CPU cores – 1, 2, 4, up to 64 (the maximum of the compute node of Devana HPC system). To assess sensitivity to problem size, we tested it on three areas of different sizes – 300x300, 1000x1000, and 3500x3500 meters. The times measured are shown in Table 1, and the scalability of the algorithm is illustrated in Figure 9. The results show that the scalability of the algorithm is not ideal. When using approximately 20 CPU cores, the algorithm's efficiency drops to about 50%, and with 64 CPU cores, the efficiency is only 15-20%. The efficiency is also affected by the problem size – the larger the area, the lower the efficiency, although this effect is not as pronounced. In conclusion, for effective use of the algorithm, it is suitable to use 16-32 CPU cores and to achieve maximum efficiency of the available hardware by appropriately dividing the study area into smaller parts. Using more than 32 CPU cores is not efficient but still allows for further acceleration of the computation.
Final evaluation
We found that achieving good results requires carefully setting the parameters of the algorithms used, as the number and quality of the resulting tree positions depend heavily on these settings. If obtaining the most accurate results is the goal, a possible strategy would be to select a representative part of the study area, manually determine the tree positions, and then adjust the parameters of the respective algorithms. These optimized settings can then be used for the analysis of the entire study area.
The quality of the results is also influenced by various other factors, such as the season, which affects vegetation density, the density of trees in the area, and the species diversity of the vegetation. The quality of the results is further impacted by the quality of vegetation classification in the point cloud, as the presence of various artifacts, such as parts of buildings, roads, vehicles, and other objects, can negatively affect the results. The tree segmentation algorithms cannot always reliably filter out these artifacts.
Regarding computational efficiency, we can conclude that using an HPC environment provides a significant opportunity for accelerating the evaluation process. For illustration, processing the entire study area of Petržalka (3500x3500 m) on a single compute node of the Devana HPC system took approximately 820 seconds, utilizing all 64 CPU cores. Processing the same area in CloudCompare on a powerful PC using a single CPU core took approximately 6200 seconds, which is about 8 times slower.
Full version of the article SK
Full version of the article EN
Authors
Marián Gall – Slovak National Supercomputing Centre
Michal Malček – Slovak National Supercomputing Centre
Lucia Demovičová – Centrum spoločných činností SAV v. v. i., organizačná zložka Výpočtové stredisko
Dávid Murín – SKYMOVE s. r. o.
Robert Straka – SKYMOVE s. r. o.
References::
[1] https://www.greenvalleyintl.com/LiDAR360/
[2] https://github.com/CloudCompare/CloudCompare/releases/tag/v2.13.1
[3] https://github.com/ultralytics/yolov5
[4] https://www.kaggle.com/ultralytics/coco128
[5] https://github.com/heartexlabs/labelImg
[6] Roussel J., Auty D. (2024). Airborne LiDAR Data Manipulation and Visualization for Forestry Applications.
[7] Popescu, Sorin & Wynne, Randolph. (2004). Seeing the Trees in the Forest: Using Lidar and Multispectral Data Fusion with Local Filtering and Variable Window Size for Estimating Tree Height. Photogrammetric Engineering and Remote Sensing. 70. 589-604. 10.14358/PERS.70.5.589.
[8] Silva C. A., Hudak A. T., Vierling L. A., Loudermilk E. L., Brien J. J., Hiers J. K., Khosravipour A. (2016). Imputation of Individual Longleaf Pine (Pinus palustris Mill.) Tree Attributes from Field and LiDAR Data. Canadian Journal of Remote Sensing, 42(5).
[9] Ester M., Kriegel H. P., Sander J., Xu X.. KDD-96 Proceedings (1996) pp. 226–231
[10] Kuhn H. W., “The Hungarian Method for the assignment problem”, Naval Research Logistics Quarterly, 2: 83–97, 1955
 Chceš študovať superpočítače? 7 May - Zvažuješ magisterské štúdium a láka ťa svet vysokovýkonných výpočtov, umelej inteligencie a dátovej vedy?
  Strategický rozvoj a internacionalizácia 30 Apr - Národné superpočítačové centrum (NSCC) navštívil Jari Hämäläinen, uznávaný fínsky expert a poradca rektora Slovenskej technickej univerzity v Bratislave (STU) pre strategický rozvoj a internacionalizáciu. Stretnutie s projektovou koordinátorkou NSCC, Luciou Malíčkovou, otvorilo dvere novej úrovni spolupráce medzi akademickou sférou a špičkovou výpočtovou infraštruktúrou.
 Artificial Intelligence and a Supercomputer as a New Weapon Against Environmental Disasters 26 Mar - Scientists from Nitra, Slovakia are teaching machines to predict industrial failures before they can cause damage. Thanks to collaboration with the European supercomputer LUMI, they have developed a digital “guardian” capable of detecting pipeline leaks or manufacturing faults with high accuracy—helping protect both the environment and companies’ budgets.