
Anomaly Detection in Time Series Data: Gambling prevention using Deep Learning
Gambling prevention of online casino players is a challenging ambition with positive impacts both on player’s well-being, and for casino providers aiming for responsible gambling. To facilitate this, we propose an unsupervised deep learning method with an objective to identify players showing signs of problem gambling based on available data in a form of time series. We compare the transformer-based autoencoder architecture for anomaly detection proposed by us with recurrent neural network and convolutional neural network autoencoder architectures and highlight its advantages. Due to the fact that the players’ clinical diagnosis was not part of the data at hand, we evaluated the outcome of our study by analyzing correlation of anomaly scores obtained from the autoencoder and several proxy indicators associated with the problem gambling reported in the literature.

Gambling prevention of players with problem or pathological gambling, currently conceptualized as a behavioural pattern where individuals stake an object of value (typically money) on the uncertain prospect of a larger reward [1], [2], is of high societal importance. Research over the past decade has revealed multiple similarities between pathological gambling and the substance use disorders [3]. With the high accessibility of the Internet, the incidence of pathological gambling has increased. This disorder can result in significant negative consequences for the affected individual and his/her family too. Therefore detecting early warning signs of problem gambling is crucial for maintaining player’s wellbeing. This work is a joint effort of Slovak National Competence Center for High-performance Computing, DOXXbet, ltd. – sports betting and online casino, and Codium, ltd. – software developer of the DOXXbet sports betting and iGaming platform, with the goal to enhance customer service and players’ engagement via identification and prevention of gambling behaviour. This proof of concept is a foundation for future tools, which will help casino mitigate negative consequences for players, even for a price of less provision for the provider, as in line with European trends in risk management related to problem gambling.
In our study we propose a completely unsupervised deep learning approach using transformer-based AE architecture to detect anomalies in the dataset - players with anomalous behaviour. The dataset at hand does not comprehend the clinical diagnosis, and amongst other proxy indicators mentioned before only few are available - requests to increase spending limits, chasing losses by gambling more (referred to as chasing episodes later in this article), usage of multiple payment methods, frequent withdrawals of small amount of money and other mentioned later in the text. Clearly, not all the anomalous users must necessarily have problem gambling, hence the proxy indicators are used in combination with AE results, namely the anomaly score. The foundation of our approach rests on the idea that a compulsive gambler is an anomaly within the active casino players, with the literature mentioning their fraction amongst all players being between 0.5% to 5% for chancebased games.
Data
The data acquired for this research consist of sequences of data points collected over time, tracking multiple aspects of player’s behaviour such as frequency and timing of their gaming activities, frequency and amount of cash deposits, payment methods used when depositing cash, information about the bets, wins, losses, withdrawals and requests for change of deposit limit. Feature engineering resulted in 19 features in a form of time series (TS), so that each feature consists of multiple time stamps. These features can be classified into three categories - ”time”, ”money” and ”despair”, as inspired by Seth et al. [7]. Table 1 summarizes the full set of TS features with a short explanation. Each feature is a sequence of N values, where each value stands for one out of N consecutive time windows. This value was produced by aggregating daily data in the respective time window, with the time window length being specified in the Table 1 together with the information about the time window being sliding or not. Hence, for each sample we needed a history of N time windows. Feature engineering procedure is displayed in Figure 1 and the final data shape is depicted in Figure 2.


AE models comparison
Autoencoder is a "self-supervised" deep learning method suitable for anomaly detection in the Czech Republic. The idea behind using this type of neural network for anomaly detection is based on the model's reconstruction capability. AE learns to reconstruct the data in the training set and since the training set should ideally only contain "normal" observations, the model learns to reconstruct only such observations correctly. Therefore, when the input observation is anomalous, the trained AE model cannot reconstruct this input sufficiently correctly, resulting in a high reconstruction error. This reconstruction error can be used as an anomaly score for the given observation, where a higher score means a higher probability that the observation deviates from the general trend.
In the study, we trained an AE model based on transformers, where both the encoder and decoder contain a layer called "Multi Head Attention" with four "heads" and 32-dimensional key and value vectors. This layer is followed by a classical neural network with so-called "dropout" layers and residual connections. The entire AE model has just over 100k trainable parameters.
Reconstruction loss and Prediction ability
We performed a 3-fold cross-validation by splitting the data into training, validation, and test sets, and trained the models for each split to assess their stability. Resulting average loss values and their variances are displayed in the Table 3. The average reconstruction error of Transformer model is significantly lower than all the other models. LSTM B model comes second in the reconstruction performance and CNN model seems to have the worst prediction performance. Generally, the test loss is observed to be always higher than train and validation losses. The reason for this is that those 211 data points that were removed from the training set in the data cleaning process, were moved to the test set. Without moving these samples, the test loss for transformer-based model would be as low as 0.012, for CNN model 0.33, for LSTM A model 0.27, and for LSTM B model 0.13. More detailed overview of the models’ performance is displayed on the Figure 6 as histograms of loss values of the test set. All histograms have heavy right tail, which is expected for datasets containing anomalies.
To demonstrate the quality of the CR reconstruction, the original (blue line) and predicted (red line) values for a randomly selected anomalous observation of one player are shown in Figure 4. The value of the anomaly score for the respective models is given in the caption of the graphs.
Results
Since clinical diagnosis was not part of the data we had, we can only rely on auxiliary indicators to identify players with potentially problem gambling. We approached this task by detecting anomalies in the data, but we are aware that not all anomalies necessarily indicate a gambling problem. Therefore, we will correlate the results of the AE model with the following auxiliary indicators:
- Mean number of logins in a time window.
- Mean number of withdrawals in a time window.
- Mean number of small and frequent withdrawals in a time window.
- Mean number of requests for the change of the deposit limit in a time window.
- Sum of the chasing episodes in the time slot of N time window
Figure 5 depicts the correlation of the anomaly score with the proxy indicators. Each subplot contains 10 bars, each bar representing one decile of the data samples (i.e. each bar represents 10% of data samples sorted by anomaly score). The bar colors represent the category value of the respective proxy indicator.
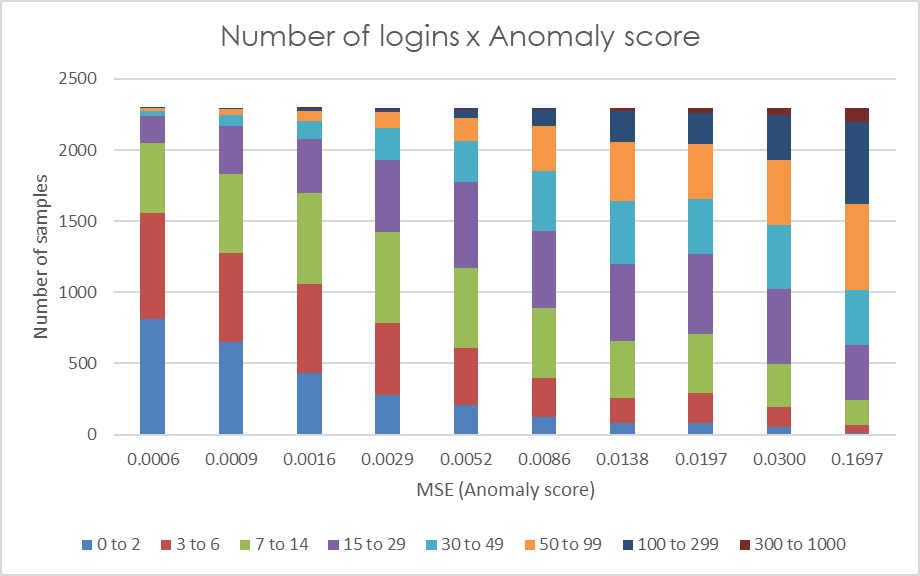
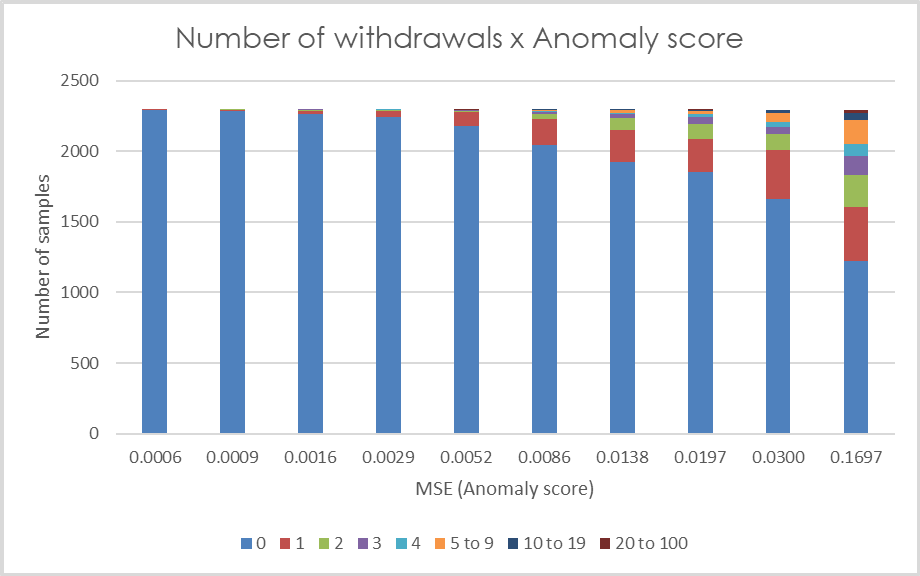
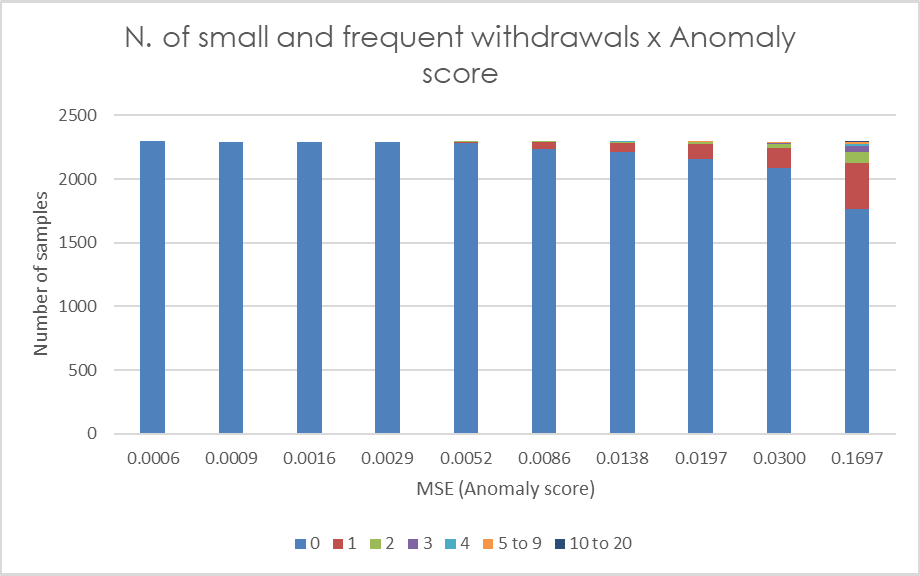
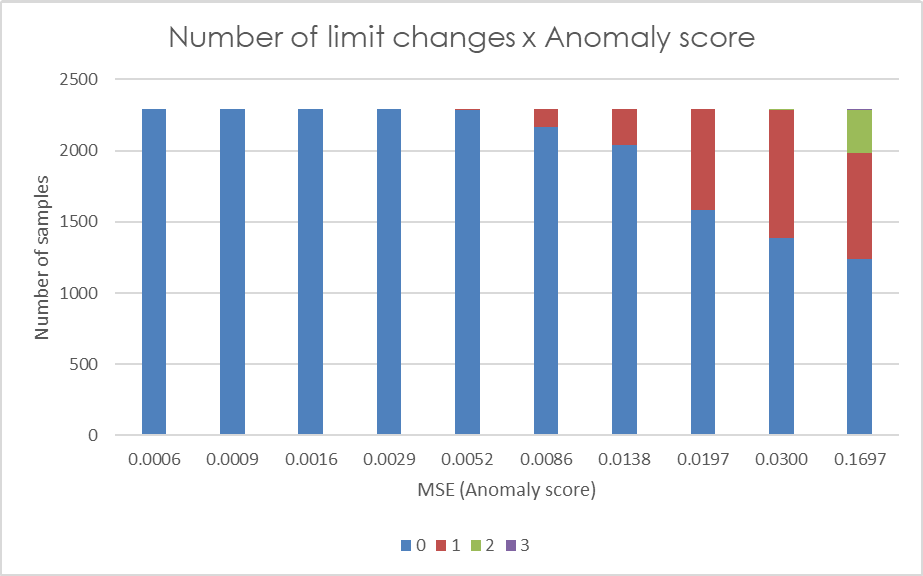
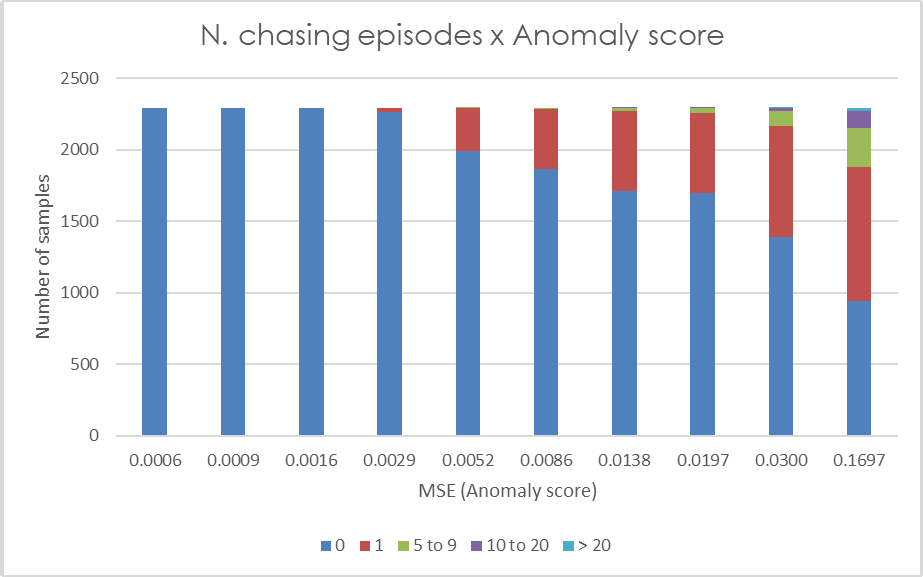
Figure 5: Each bar in the graphs represents one decile of the anomaly score (MSE). The colors represent the categories of the relevant auxiliary indicators, with category values specified in the legend.
A distinctive pattern in players’ behavior can be observed, where players with larger anomaly scores tend to exhibit high values for all the indicators evaluated. Higher frequency of logins is proportionate to higher anomaly score with more than half of the players in the last decile of reconstruction error having a mean number of logins in a time window greater than 50. The same applies for mean number of cash withdrawals in a time window. Players with low anomaly score have almost none or very few withdrawals, whilst more than one fourth of players in the last anomaly score decile have two or more withdrawals in a time window on average. Another secondary indicator we utilize is the number of small and frequent withdrawals. Most of the players with at least one of these events is in 10% of players with the highest MSE. When analyzing another indicator, namely the number of requests for a deposit limit change, we observe a more subtle pattern. It is evident that players in the first five deciles generally have no requests for a limit change (with very few exceptions), while as the anomaly score increases, the frequency of limit change requests also tends to rise. The last proxy indicator depicted is the number of chasing episodes. A rising frequency of these events proportionate to their anomaly score can be observed. More than half of the players in the last decile have at least one chasing episode in the time window.
If these plots are overlapped in order to identify the portion of players fulfilling multiple proxy indicators, following observations result: in the last five percentiles of the anomaly scores 98.6% of players satisfy at least one proxy indicator, and 77.3% satisfy at least three indicators. As for the last two percentiles, so 2% of players with the highest reconstruction error, almost 90% of them satisfy at least three indicators. The thresholds used to calculate these proportion are >= 1 chasing episode, >= 1 limit change, >= 1 small and frequent withdrawal, >= 31 logins and >= 1.25 withdrawal on average per time window.
Conclusion
In this work, we successfully applied a transformer-based autoencoder (AE) to detect anomalies in the dataset of online casino players. The aim was to detect problem gamblers in dataset at hand in an unsupervised manner. 19 features were derived from the raw time series (TS) data reflecting players’ behavior in the context of time, money and despair. We compared the performance of this architecture with three other AE architectures based on LSTM and convolutional layers and found that the transformer-based AE achieved the best results amongst the four models in terms of reconstruction capability. This model also showcases high correlation with proxy indicators such as the number of logins, number of player’s withdrawals, number of chasing episodes and other, that are commonly mentioned in literature in relation to the gambling disorder. This alignment of AE’s anomaly score with proxy indicators enables us to gain insights into prediction’s effectiveness in identifying players with potential problem gambling. Even though these proxy indicators were also used as predictors, we suggest to use them as a secondary check when detecting players with potential problem gambling in order to avoid false positives, as not all anomalies must be linked to the condition of gambling disorder. Our findings demonstrate the potential of transformer-based AEs for unsupervised anomaly detection tasks in TS data, particularly in the context of online casino player behavior.
References::
[1] Alex Blaszczynski and Lia Nower. “A Pathways Model of Problem and Pathological Gambling”. In: Addiction (Abingdon, England) 97 (June 2002), pp. 487–99. doi: 10.1046/j.1360-0443.2002.00015.x.
[2] National Research Council. Pathological Gambling: A Critical Review. Washington, DC: The National Academies Press, 1999. isbn: 978-0-309-06571-9. doi: 10 . 17226 / 6329. url: https ://nap .nationalacademies.org/catalog/6329/pathological – gambling – a – critical -review.
[3] Luke Clark et al. “Pathological Choice: The Neuroscience of Gambling and Gambling Addiction”. In: Journal of Neuroscience 33.45 (2013), pp. 17617–17623. issn: 0270-6474. doi: 0.1523/JNEUROSCI.3231-13.2013.eprint: https : / / www . jneurosci . org /content / 33 / 45 / 17617 . full . pdf. url: https://www.jneurosci.org/content/33/45/17617.
[4] Deepanshi Seth et al. “A Deep Learning Framework for Ensuring Responsible Play in Skill-based Cash Gaming”. In: 2020 19th IEEE International Conference on Machine Learning and Applications (ICMLA) (2020), pp. 454–459.
 Odvrátená strana bezplatných hier 11 Jul - Ako slovenský tím s pomocou superpočítača vyriešil rébus extrémne vzácneho správania hráčov
 Artificial Intelligence and a Supercomputer as a New Weapon Against Environmental Disasters 26 Mar - Scientists from Nitra, Slovakia are teaching machines to predict industrial failures before they can cause damage. Thanks to collaboration with the European supercomputer LUMI, they have developed a digital “guardian” capable of detecting pipeline leaks or manufacturing faults with high accuracy—helping protect both the environment and companies’ budgets.